An operator who knows how to interpret the behavior of the market will be in a better position to be able to adapt his trading strategy. If he could anticipate an uptrend, the trader could buy an asset to profit from it. And, if he could spot a downtrend in the future, he could sell his position to avoid losses.
- Trading in the direction of a strongly defined trend could reduce trading risk and increase the possible profit.
- Technical analysis has specific tools to identify the market situation at all times and be able to determine the strength of a trend.
- One of the most used tools for this purpose is the ADX indicator. ADX is the indicator that is to confirm the formation of a market trend ultimately.
Table of Contents
What is the ADX indicator?
The ADX is a technical indicator that falls within the so-called oscillators. Its value moves within a defined range, between 0 and 100.
What ADX determines is the strength of a movement. Therefore, a solid bullish or bearish trend will present the same values in this indicator, resulting in weak trends in either direction.
For this reason, the ADX is the indicator used to determine if a market is in a sideways situation, oscillating in a specific range or, on the contrary. Suppose that market is starting a new trend.
However, two indicators are also usually added that complement the ADX. One is the positive directional indicator. And one is the negative directional indicator. Together, they help find out if the trend is up or down.
The ADX calculation is based on a moving average of expanding an asset’s price range over a given time. Usually, 14 days is used as the calculation period.
What is ADX use?
The ADX is a crucial indicator to adapt trading strategies at all times.
An ADX below 25 indicates that the price of an asset is moving without a defined trend.
If the ADX remains below this value for a while, the price of the asset will asset price will oscillate. In this case, an operator will be able to take advantage of this movement by applying range trading strategies, mainly in the short term, knowing that it is unlikely that the value will take off from its latest prices.
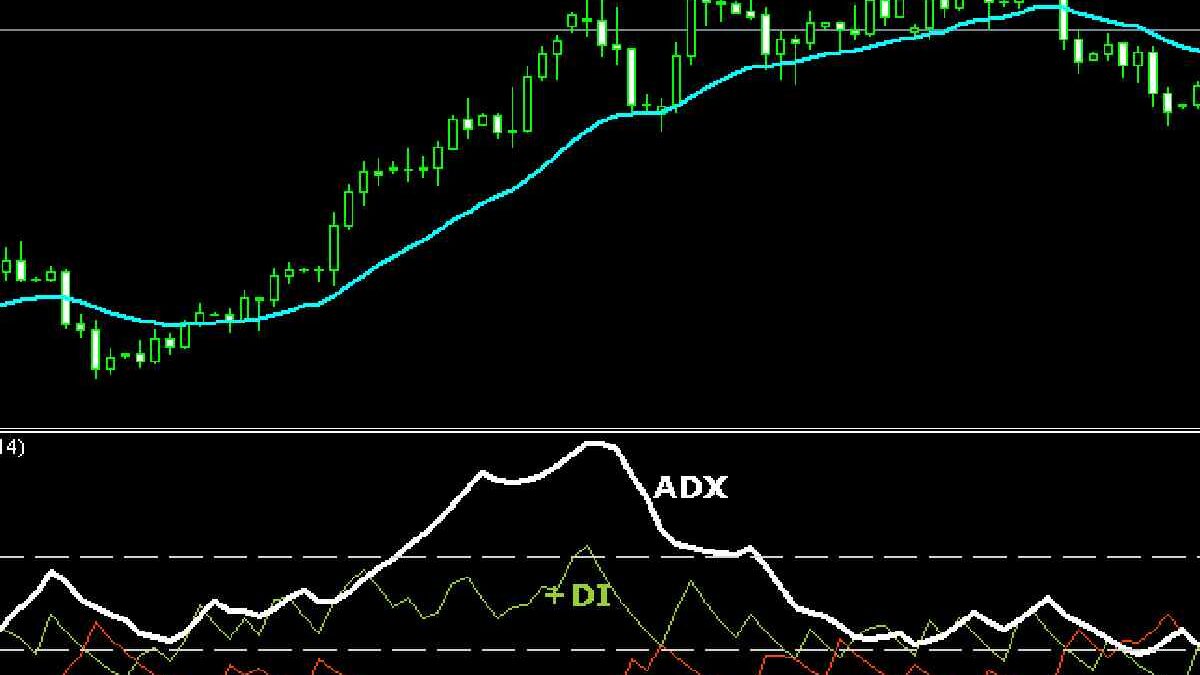
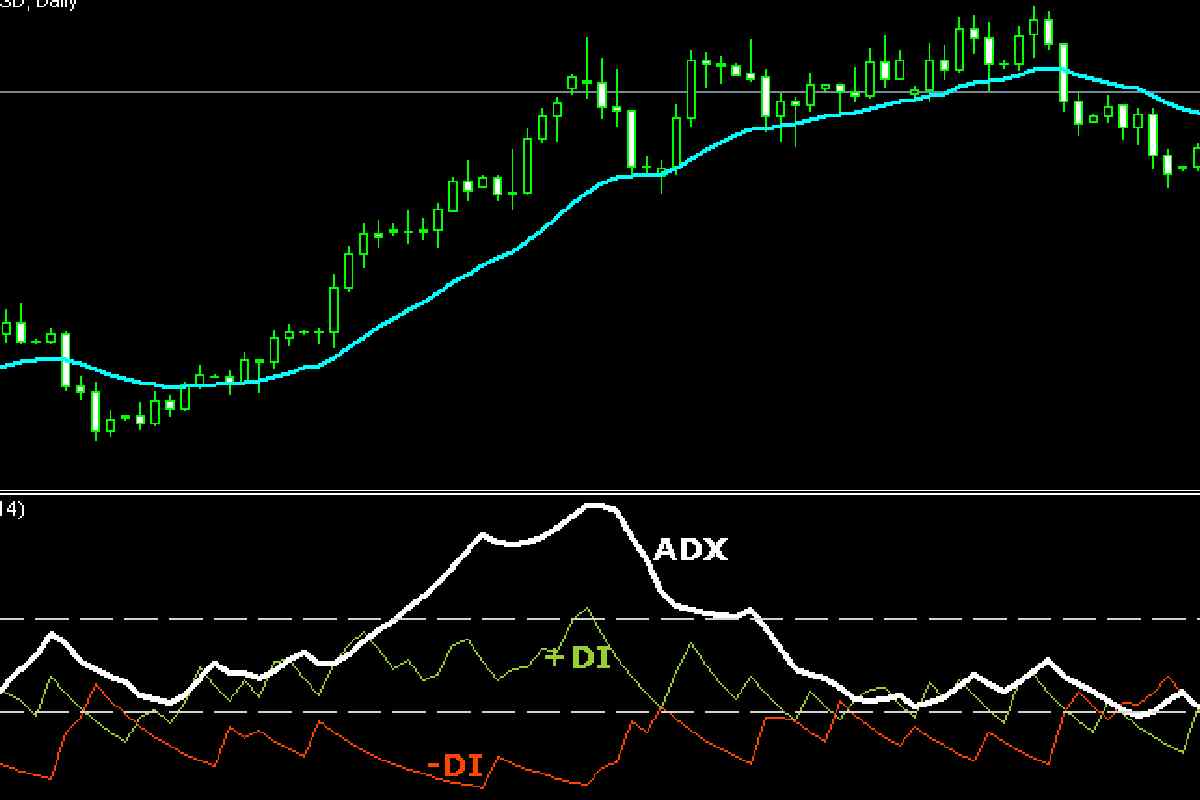
As can see in the graph, the upward trend that began in January 2018 is reflected in the ADX. The indicator exceeded the value of 25 at the beginning of the year and reached 60 first days of February. ADX began to decline. Signaling a progressive deterioration in the price’s upward momentum.
Can be seen in the following graph, in which two horizontal green lines represent the limits of the said interval. With ADX stabilized at such low values, a trader could have employed a range of strategies with these limits.
The chart has also been marked with an orange arrow when the EUR/USD pair broke down the established range.
A signal also accompany the break of the downtrend on the ADX. As you can see in the chart below, when the price broke the downtrend line, drawn in green, the ADX turned lower again, demonstrating the loss of trend strength and predating swing movements. Within a smaller range.
How To Know If A Trend Will Be Bullish Or Bearish?
Unlike other indicators, the ADX takes values that do not express the direction of the trend but only its strength. In other words, if the value of one stock falls at the same speed as another rises, then its ADX will be similar.
Is can a risk if only that value is take into account. If a trader spots a strong trend and assumes it will be bullish, they may decide to invest in it. But if, in the end, the value suffered a downtrend, the trader will have lost his money. The same could happen the other way around: a trader can sell his stock expecting a downtrend and miss out on profits after the value has risen.
Is Why ADX Is Often Supplementing With Two Lines On Your Chart.
These are the positive directional indicator (+DI) and the negative directional indicator (-DI). Generally, their lines represent green and red, respectively, to differentiate them from the black line of the ADX.
Similar To ADX Itself. Directional Indicators Also Show The Strength Of A Trend.
Therefore, probabilistically, the direction will be given by which of the two has a higher value.
A trader will want to know which direction the trend will take so that they can act on it. Then. You will look at the evolution of the indicator lines. The Positive Directional Indicator (+DI) is above the Negative Directional Indicator. You will know that the trend will increase.
A Chart like this will warn the trader that the trend that is about to form in that asset will undoubtedly be bullish. You will be able to invest in it with greater confidence and profit from that position held during the uptrend. Therefore, your decision will be orient to benefit from this increase in value.
The trader can anticipate a downtrend if he observes that. As the strength of the ADX increases, indicating a future trend. The negative directional indicator (-DI) exceeds the positive (+DI). Otherwise, it is give in the same way. This is in the following graph.
In this case, the operator will seek not to suffer the losses derived from the downward trend of that value. Therefore, it will be orient to dispose of the asset during its loss of value.
Trading Strategies With The ADX Indicator
Throughout the previous example, the usefulness of ADX in trading has be show. It is utility is summarize below:
- Determine the strength of a trend.
- Identify trend changes.
- Identify price movements in outline ranges.
The information provide by the ADX allows you to use this indicator to define trading strategies. When describing these strategies, it is essential to point out that The ADX must always use in conjunction with the study of the behavior of the asset’s price on which it is operating.
The joint study of the behavior of the price and the ADX is the best way to obtain the maximum result of this indicator. This is because the ADX provides additional information to the mere price Analysis.
- Anticipation of a possible break in a trend ADX starts to decrease, even if the price does not yet signal a change in momentum.
- Signal of a range breakout, with the consequent trading opportunity.
In general, keep in mind that very strongly define trends usually appear after an asset moves within a specific range. The bearish trend of the example explain on the EUR/USD pair is proof of this.
Also Read: How to Build a Forex Model? Technical Analysis, Importance, And more